Design monitoring
We consider monitoring parameters and methods suited to site conditions and challenges.
Water-use visualization
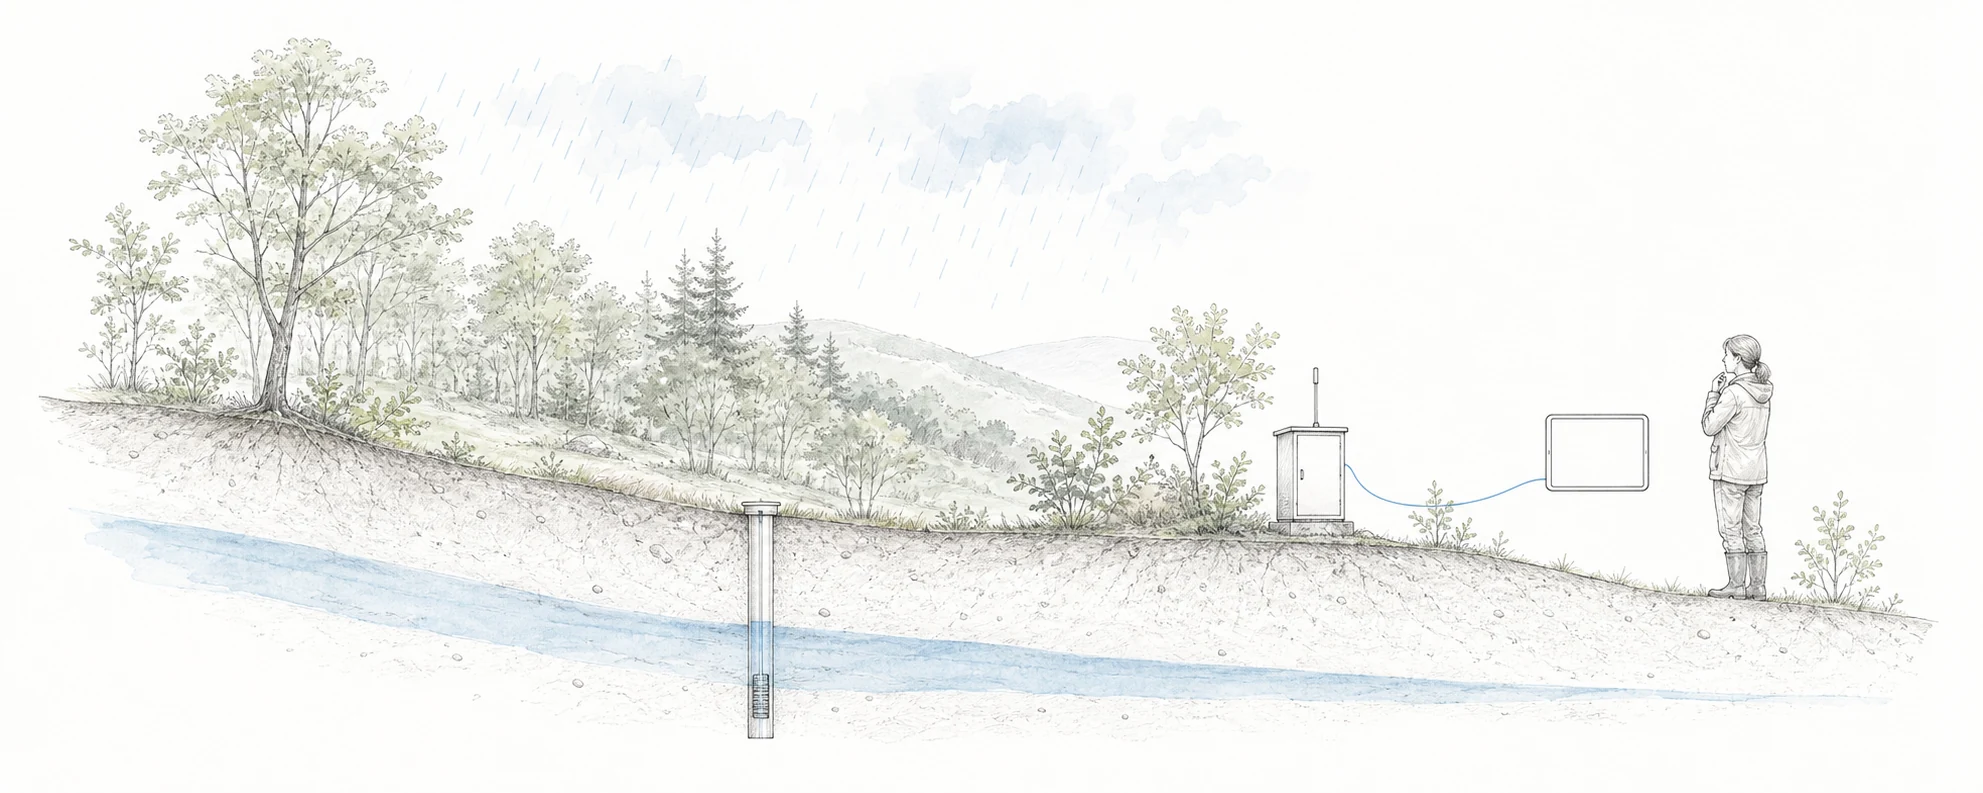
Groundwater levels, rainfall and changing water use: we connect field data and present it in ways that make water conditions easier to understand.
Explore our support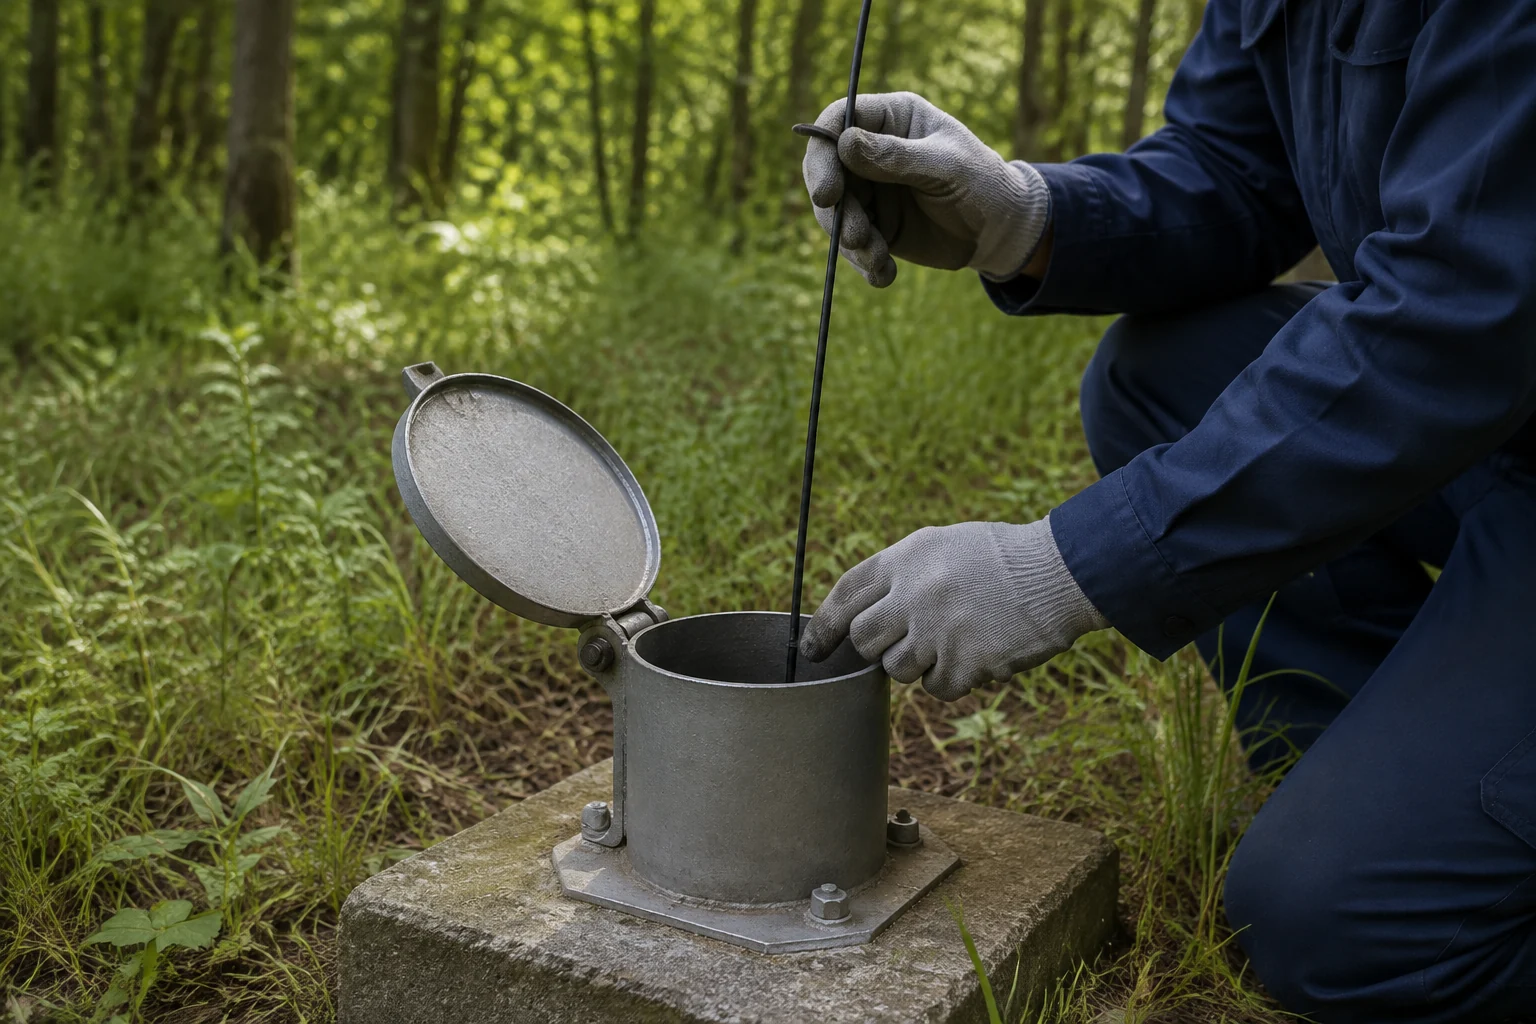
We clarify monitoring objectives and continuously collect the data needed. Changes in the numbers become information that businesses and communities can use to make decisions.
We consider monitoring parameters and methods suited to site conditions and challenges.
We organize data collected over time to visualize water conditions and changes.
We consider the next actions in the context of water use and local conditions.
From challenges in the field to ideas for the future.
Tell us what you have in mind.